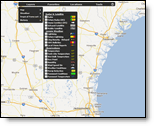
When your cursor is positioned over any one of the Menus they become visible, however after a period of inactivity the Menus will again become transparent. If you move your cursor off of the function menu it will become transparent more quickly.
|
|
The Layers menu includes four separate groupings. Nested under each group is a list of available layers. Access the layers by moving your cursor over the menu.
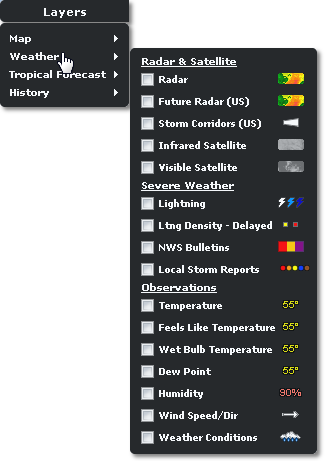
To view a layer click the check box in front of the layer name. The layer data will be visible in the content display and the layer will be listed in the Layer Settings menu. Click the check box in the Layer Settings to remove the layer from the content display. The layer will be available under the recently viewed section. Not all map layers are able to be displayed at the same time, this is by design.
You can choose to turn layers off and on in order to view only the data of interest. Some layers are not available at every zoom level, this is by design. Some users may have Custom Layers available in addition to those listed.
![]() Click the preferences arrow for details about layer data and preferences.
Click the preferences arrow for details about layer data and preferences.
|
Map Layer |
Description |
|
User Locations |
Custom locations that you or your Account Administrator have created. Hover over the preferences arrow to enable or disable the show labels (location names) option. |
|
Traffic Speeds |
Color coded traffic conditions including closures, construction, accidents and delays. Available to Platinum users of the North American and Global editions. |
|
Traffic Cameras |
Location of North America traffic cameras. Hover over camera icon to view most recent camera image. Update is manual and frequency may vary by camera. Available to Platinum users of the North American and Global editions. |
|
Airports |
Airports with runways of greater than 8000 feet. |
|
Forecast Locations |
Location of official forecast stations. When clicking on the layered map the forecast provided by the nearest forecast point is loaded. |
|
RoadCast Forecasts |
Locations used to produce the RoadCast Forecast. Click on a RoadCast point to load the local forecast. The RoadCast Forecast is included in the first 24 hours of the Hourly forecast table. RoadCast Forecasts are available in the Pavement Forecast and Airport Operations editions. |
|
Custom Forecast Points |
Custom Forecast Points are used to generate a local forecast. Custom Forecast Points are an optional purchase. |
|
Official Stations |
Location of official surface weather observations from NWS, EC and FAA sites. |
|
Unofficial Stations |
Location of unofficial surface weather observations from other sources. The capabilities of unofficial observation stations vary and not all stations report all conditions. |
|
|
Location of observations from the Road Weather Information Systems (RWIS) from participating states. RWIS observation capabilities vary between sensors. Hover over the RWIS marker for data. Available in the Pavement Forecast Transportation, Transportation, Airport Operations, and Alberta editions. |
|
NERC Boundaries |
Northern American Electric Reliability Council regional boundaries. Available in the Energy and Utility editions. |
|
IOU Boundaries |
Investor Owned Utilities regional boundaries. Available in the Energy Edition. |
|
Co-op Boundaries |
Cooperative regional boundaries. Available in the Energy Edition. |
|
Municipal Boundaries |
Municipal regional boundaries. Available in the Energy Edition. |
|
Transmission Lines |
Transmission Lines. Available in the Energy Edition. |
|
Custom Layers |
Shape file data provided by user. Custom Layers are an optional purchase. |
Layers which have animation capability include a time stamp on each frame of data.
|
Weather Layer |
Description |
|
|
Composite radar over the US and Canada includes colors indicating precipitation type and intensity. Radar can be animated. Images are updated every 5 minutes in the US grid and every 10 minutes over Canada. Due to the difference in update frequency there will be twice as many frames of data over the US enabling the radar to animate more smoothly. The transparency level is adjustable. |
|
|
90 minute forecast of radar trends available within the US radar grid. Future radar animates in 5 minute intervals. |
|
|
Forecast path of strong to severe storms which are color-coded to indicate the type of storm activity. Storm corridors which contain a tornadic vortex signature (TVS) will flash. Some Canadian locations that are located within the footprint of US radar may be capable of receiving storm corridors generated via US radar data. |
|
|
Infrared satellite images are updated every 30 minutes and can be animated. |
|
|
Visible satellite images are updated every 30 minutes and can be animated. |
|
|
Cloud-to-ground and cloud-to-cloud lightning data for a purchased region, depicted by a gold dotted box. Lightning is color-coded to show age and is updated each minute. Lightning strikes are only visible in your purchased region, not around your roaming location. Lightning data is an optional purchase. To view lightning display options hover over the preferences arrow in the Layer Settings. In the Energy, Wind Energy, and Utility editions ground lightning symbols can be set to vary in size by amplitude. |
|
Future Lightning |
Color-coded shapes identify areas where lightning is probable within the next 60 minutes. Available to Platinum users of the North American editions. |
|
|
View a time period of up to 24 hours within the last 72 hours. Data can be saved as a CSV file for further analysis. Available in the Energy, Wind Energy, and Utility editions. |
|
|
The lightning shown in this layer is delayed 15 minutes and can be used to get a general view of lightning activity. It should not be used for making safety decisions. The layer is only available in the full US and regional zoom levels. |
|
|
While hovering a summary of all alerts issued by the National Weather Service (NWS) in effect for the county will be listed. Click the county to view the full text of each alert currently in effect. The most severe alert will be listed first (warnings first, then watches, then advisories). If a tornado warning is in effect the counties under the warning will flash. |
|
Local Storm Reports |
Recent storm reports color-coded by type. View reports from up to 30 minutes old out to six hours old. |
|
Temperature |
Temperatures for each observation site (both official and unofficial). Value is color-coded by temperature range. |
|
Feels Like Temperature |
Perceived temperature is listed in degrees Fahrenheit or Celsius. The current heat index is used if over 70°F (21°C) or wind chill if below 50°F (10°C). |
|
A measure of perceived heat which predicts the likelihood of heat stress. The values are color-coded and listed in degrees Fahrenheit or Celsius. Available in the Sports, and Turf editions. | |
|
Dew Point |
Dew Point for each observation site. The values are color-coded. |
|
Humidity |
Relative humidity for each observation site (both official and unofficial). Value is color-coded by humidity range. |
|
Wind Speed/Dir |
Arrows indicating the wind direction and speed. The arrows point in the direction the wind is blowing. The color and length of the arrows also indicate speed. |
|
Weather Conditions |
Weather or sky condition reported at each observation site (official or unofficial). Icons are coded by weather type. |
|
|
Precipitation detection marked as a Yes or No value as reported by RWIS sites having precipitation detection capabilities. Available in the Pavement Forecast, Transportation, Airport Operations, and Alberta editions. |
|
|
Pavement conditions as reported by RWIS sites having pavement condition detection capabilities. Available in the Pavement Forecast, Transportation, Airport Operations, and Alberta editions. |
|
|
Pavement temperatures from each RWIS site. Road temperature is shown first then the bridge deck temperature. Values are color-coded. Available in the Pavement Forecast, Transportation, Public Safety, Airport Operations, and Alberta editions. |
|
Global Tropical Forecast Layer |
Description |
|
Official Track |
Displays all past positions of the storm. Updated every six hours or more frequently as needed. |
|
Track Probability |
Displays a corridor over both land and water of the probable track of the storm. |
|
Wind Speeds |
Displays a color-coded contoured forecast of wind data values over both land and water areas. |
|
Rainfall |
Displays a color-coded contoured forecast of rain data values over both land and water areas. |
|
Wave Height |
Displays color-coded contoured data values over water areas. |
|
Storm Surge |
Displays color-coded contoured data values over water areas. |
|
History Layer |
Description |
|
|
Historical Storm Corridors display US storm forecast path data from the last seven days. Up to 24 hours may be displayed at one time. Customize your parameters in the Storm Display options menu. |
|
|
Displays up to 24 hours of US local storm reports within the last seven days. Set your parameters in the Storm Display options menu. |
|
Past 1 Hour Rain, Estimate |
Past 1 hour estimated rainfall (or liquid equivalent, if snow). Updated hourly. |
|
Past 3 Hour Rain, Estimate |
Past 3 hours estimated rainfall (or liquid equivalent, if snow). Updated hourly. |
|
Today's Rain so far, Estimate |
Today's estimated rainfall so far (or liquid equivalent, if snow). Amount since 6am CST (12 GMT). Updated hourly. |
|
Yesterday/Overnight Rain |
24 hour rainfall (or liquid equivalent, if snow). Updated twice daily at 1am CST and 5am CST (7 GMT and 11 GMT). Note: Estimates are updated with ground observations at mid-day, reflecting actual totals as of 6am CST yesterday to 6am CST today (12 GMT yesterday to 12 GMT today). |
|
Past 7 Days Rain |
Past 7 days actual rainfall (or liquid equivalent, if snow). Updated at 6am CST (12 GMT) daily. |
|
Past 30 Days Rain |
Past 30 days actual rainfall (or liquid equivalent, if snow). Updated at 6am CST (12 GMT) daily. |
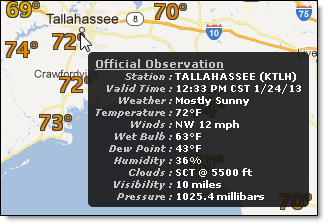
Hover over data from one of your selected layers to view additional details observed at the official reporting site. A single mouse click will load the forecast from the nearest reporting site, while a double click will zoom the map in one level.
![]()